Crystal Lattices & Phase Diagrams
- Bravais lattices, unit cells, close packingnot yet tested
- Diamond vs graphite: same atoms, different latticenot yet tested
- Phase diagrams and the iron-carbon systemnot yet tested
- X-ray diffraction from Bragg to AlphaFoldnot yet tested
In April 1912, Max von Laue persuaded two assistants in Munich to shoot a narrow X-ray beam through a copper sulfate crystal onto a photographic plate. The plate showed a regular array of spots around the central beam — proof at once that X-rays were waves of atomic-spacing wavelength and that crystals were periodic arrays of atoms, the question on which mineralogy had traded speculation since René-Just Haüy in 1784. A year later in Cambridge, William Henry Bragg and his 25-year-old son William Lawrence Bragg converted the pattern into Bragg's law — n λ = 2 d sin θ — relating diffraction angles to atomic-plane spacings. They shared the 1915 Nobel; Lawrence remains the youngest physics laureate ever.
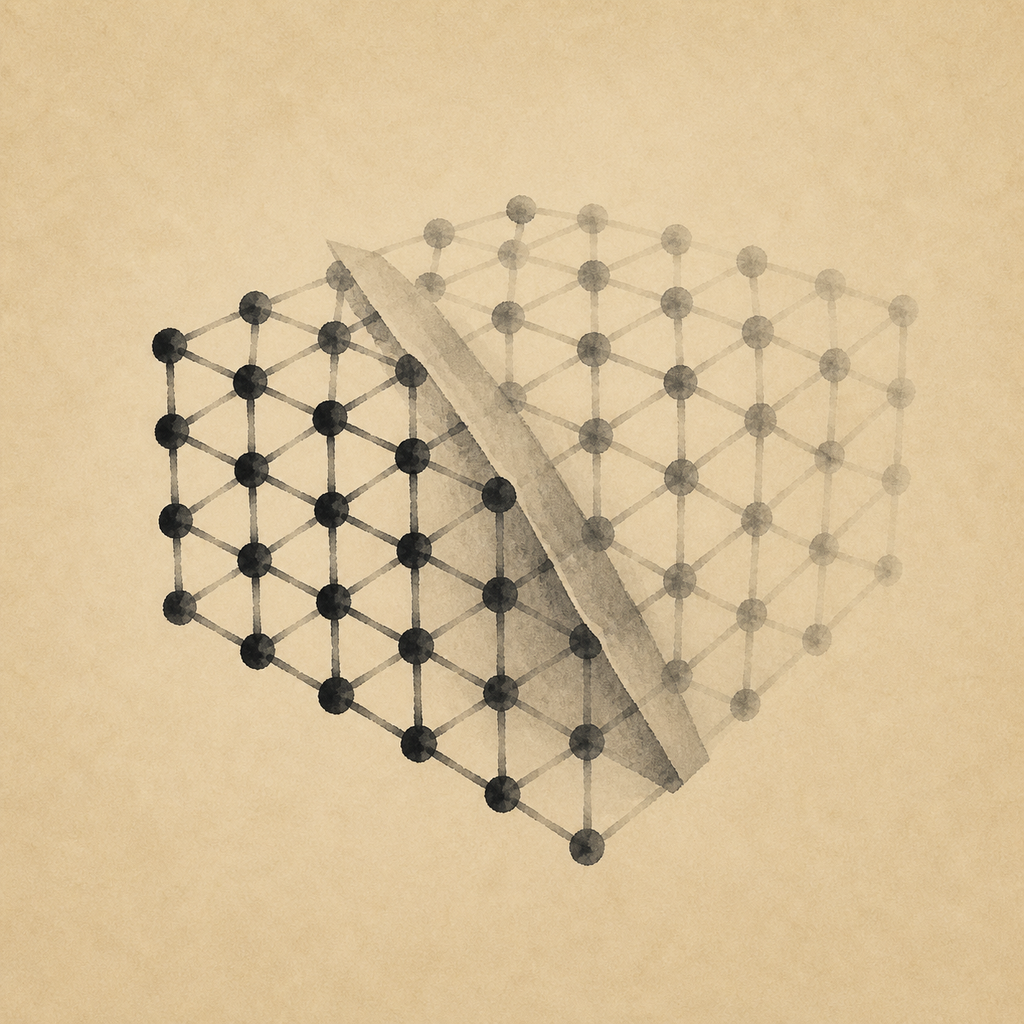
A crystal lattice is an infinite periodic array of points generated by translation of a unit cell. Auguste Bravais showed in 1850 that there are exactly 14 distinct three-dimensional lattices, distributed across seven crystal systems. Atoms occupy the lattice points with an optional basis, and the close-packed arrangements — FCC and HCP at ~74 % density — are the most efficient packings of identical spheres. The macroscopic properties of a solid follow from this microscopic geometry. Diamond and graphite are both pure carbon: diamond's tetrahedral sp³ lattice gives the hardest natural material, transparent and insulating; graphite's stacked sp² sheets are soft, opaque, and conduct along the planes. Polymorphism — multiple lattice forms of the same compound — is the rule. Tin's slow conversion from metallic β-tin to powdery α-tin below 13.2 °C, the tin pest, was anecdotally blamed for the failure of Napoleon's army buttons in the Russian winter. Which lattice wins is governed by phase diagrams: maps of which phase has the lowest free energy at each combination of temperature, pressure, and composition, constrained by J. Willard Gibbs's 1875 phase rule. The most-studied phase diagram in any science is iron-carbon, which governs steelmaking. Austenite (FCC iron, dissolves carbon to ~2 %) transforms on cooling to ferrite (BCC) or cementite; intermediate cooling gives layered pearlite; rapid quenching traps carbon as a distorted-BCC martensite, the hard but brittle phase responsible for the cutting edge of a sword. Every steelmaker, from medieval bladesmith to modern arc furnace, is reading the diagram.