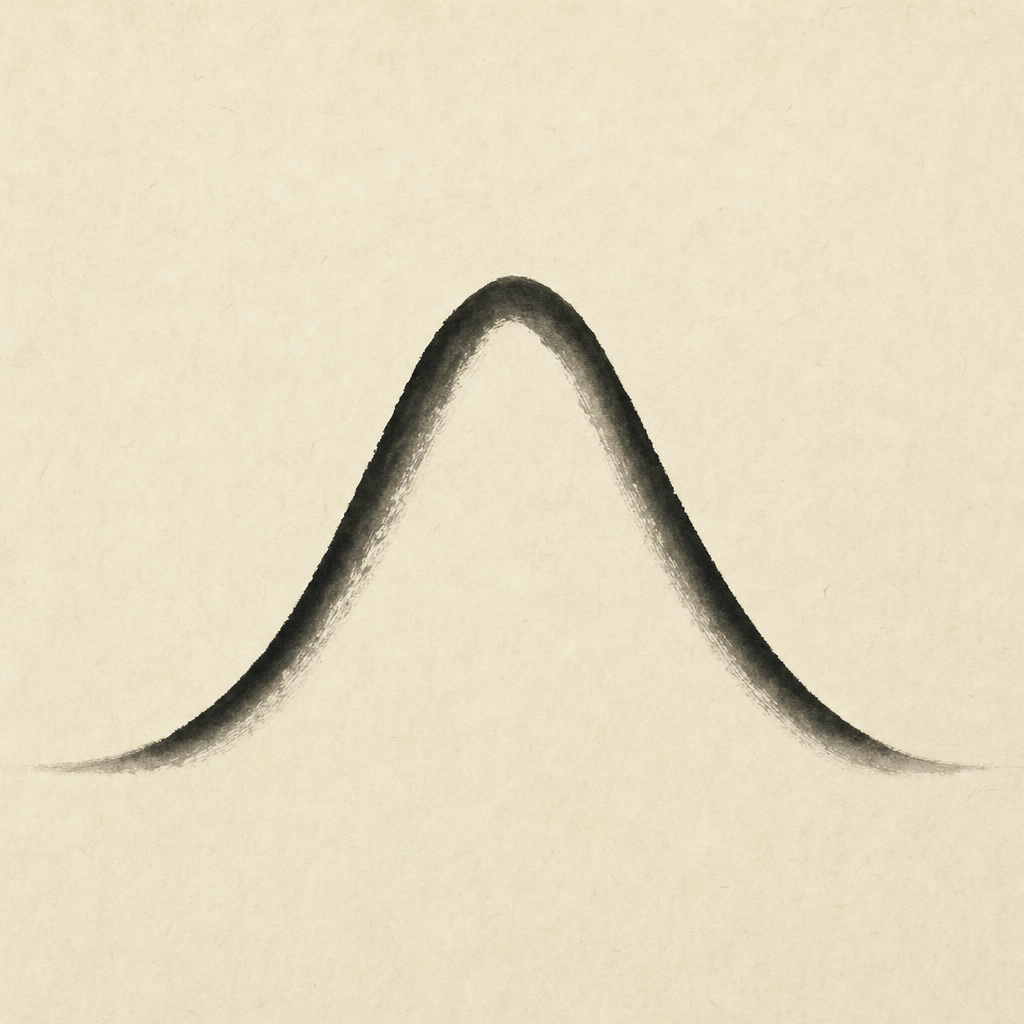
Central Limit Theorem
- Sums of i.i.d. variables go normalnot yet tested
- Averaging cancels all but mean and variancenot yet tested
- Fat tails, correlation, infinite variancenot yet tested
- De Moivre, Laplace, Lyapunovnot yet tested
Take any random process — coin flips, dice rolls, the daily change in a stock price, the height of an arbitrary person, the noise in a measurement. Add many independent samples together, divide by the count. Plot the result. Whatever the underlying distribution looked like, the histogram of averages will be a bell curve. This regularity, formalized as the Central Limit Theorem, is one of the most surprising mathematical facts about the world. The bell appears whether you want it or not, whenever the world is built out of many small independent contributions, and it is much of why statistics is possible at all. The shape has a name in every language, but its universality is the genuinely strange part: the bell does not care whether you summed dice, incomes, or measurement errors, only that you summed many of them and that none dominated the rest.
The theorem was glimpsed by De Moivre in 1733 (analyzing binomial distributions), generalized by Laplace, and rigorized by Lyapunov around 1900. The intuition is that averaging cancels structure: whatever quirks the underlying distribution had, repeated independent sampling averages them out, leaving only the broadest features (the mean and variance). More precisely, the theorem is about a rate: the spread of the average shrinks like one over the square root of the sample size, so to halve your uncertainty you need four times the data — the unglamorous arithmetic behind every 'larger study.' It is a sharper statement than the law of large numbers, which only promises the average lands on the true mean; the CLT tells you the exact shape of the error around it, which is what lets you put numbers on confidence. The reason the bell, and not some other shape, is the universal limit is that summing independent quantities convolves their distributions, and repeated convolution smooths away every feature except location and width. How fast the approximation arrives depends on the underlying distribution: symmetric, light-tailed quantities converge in a handful of samples, while skewed or heavy-tailed ones may need thousands before the bell can be trusted, which is why the textbook 'n ≥ 30' is a rule of thumb, not a law. The theorem fails precisely when its assumptions fail: when a single contribution can dominate the sum (heavy-tailed distributions, like earthquake magnitudes or financial returns under stress), when contributions are correlated (a market crash where everything moves together), or when the underlying distribution has infinite variance. The 2008 financial crisis was, in this sense, a CLT failure: the assumption of independent contributions broke down, the tail thickened, and the standard models were wildly miscalibrated for the resulting risk.